In April, The CLB 6/7 class at the Welcome Centre conducted a school census. This activity involved several steps and several days' work. The end result was a set of lessons that utilized all four skills and were, I hope, fun and engaging for the students. These types of separate-but-connected multi-stage activities take a lot of class time, but are often worth it in the end. Here are some of the steps involved in this one:
Planning
After introducing the idea of a census, the class was divided into three groups of 4-5 students. Each group came up with at least five survey questions. At this stage, we reviewed question forms and discussed which questions were culturally appropriate to ask their peers.
Conducting a survey
Students learned how to make polite requests and ask permission using modals, and role-played conversations with their classmates. They needed to open, maintain and close each conversation, and we focused on accuracy when asking questions. Even though higher-level students are familiar with question forms, they often fail to use the correct form in everyday speech. When the time came to conduct the survey, other teachers were kind enough to let us interrupt their classes for about 15 minutes. Representatives from each of the three groups went into every class and asked as many students as they could their questions.
Compiling the information
Asking the questions turned out to be the easy part! Sorting through the results proved much more challenging. Luckily, in all of the confusion, students did a lot of communicating. Finally, each group produced a single sheet of paper with their results.
Tables, graphs and charts
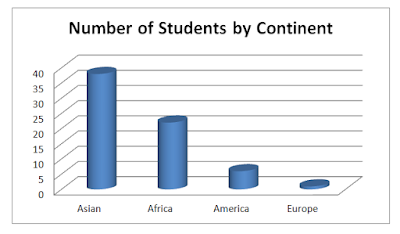
In the computer lab, each student was responsible for creating a graphic representation of at least one question. They used Word or Excel, and produced bar graphs and pie charts to visually represent their data. Some students were already pros at creating graphs, while others had never done this type of work before. After a brief introduction, I helped students as needed, and students helped each other as well.
Interpreting the data
Finally, with the data represented both graphically and numerically, each group produced a written summary of their survey results. Prior to writing the summary, we had a lesson on describing graphs and charts from the LINC 5-7 Classroom Activities binder. Once the surveys were completed, the results were posted on the bulletin board outside the classroom.
What we learned
Here are some of the graphs produced by the students:


That's really interesting! What a great idea!
ReplyDelete